Debugging Expanders
It may be difficult to track the mapping context while testing your expanders. We provide some tooling through the nsx-support intellij plugin which enables debugging of mapping files.
The debugging support enables the following:
- Contextual inspection of the mapping state at each evaluation point.
- Ognl evaluation on the current context.
Debug support was only added with expanders-core version 5.18.0. Make sure it is on your intellij classpath when
using breakpoints in mapping files.
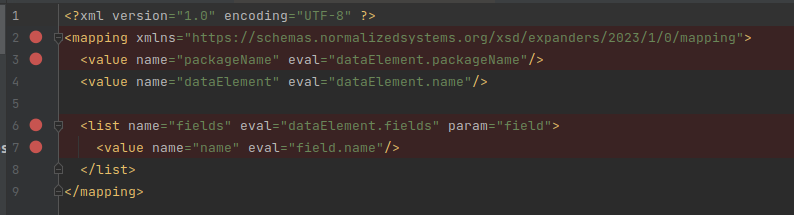
Adding breakpoints to the mapping file
The first step is to add breakpoints in the mapping file you want to inspect. Breakpoints can be added to every line in
the xml file which contains an evaluable tag. This will mostly be an eval attribute but also includes attributes like
if on <group> or this on <artifact>.
Additionally, a breakpoint can be put onto the <mapping> tag itself. This will be hit when evaluation of the entire
file is complete. This can be useful to inspect the resulting state of the mapping.
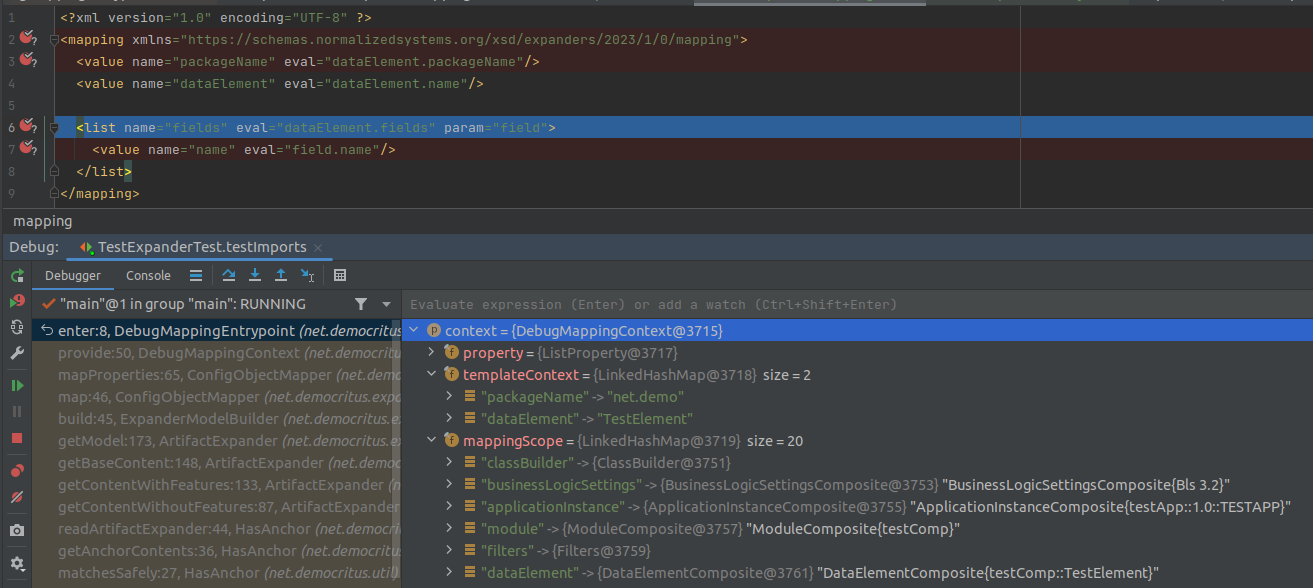
Inspecting the debug context
Now onto the fun part! When debugging an expander test in intellij ,
mapping breakpoints will be hit while evaluating the mapping file. For example when testing testBase() the mapping will
be evaluated when running tester.testBase(..).
You can now inspect the context when a breakpoint is hit as seen in the image below. It includes a mappingScope which
is used for evaluating ognl expressions in the mapping file and a templateContext which is used for rendering the .stg
template afterward.
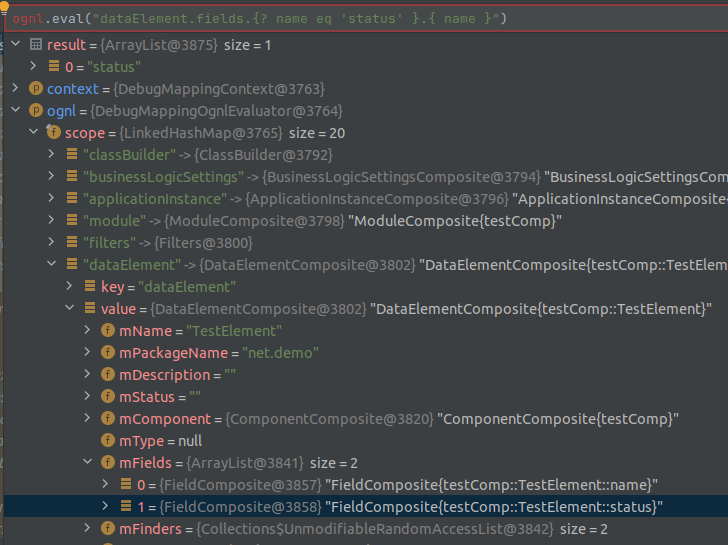
Interactive Ognl expressions
Ognl may not always be an obvious language. To interactively evaluate Ognl expressions against the current mapping scope
an ognl object is provided which can evaluate expressions as string.
Debugging during program/application expansion
Instead of debugging via the test framework, you can attach your debugger to the expansion of an actual project.
Within your project, start the program expansion (or limit it to a single expander with includeExpanders). In your expander project, attach the JVM debugger to the debug port (e.g. 9999).
mvn expanders:expand -Dexpansion.debug.address=localhost:9999