How do I create a diagram?
On diagrams
Diagram Components are essential for providing visual representations of your model. When defined, the editor
generates a component that can render diagrams. These diagrams are typically displayed within the 3-pane and
diagram views, offering users an intuitive way to understand complex model structures.
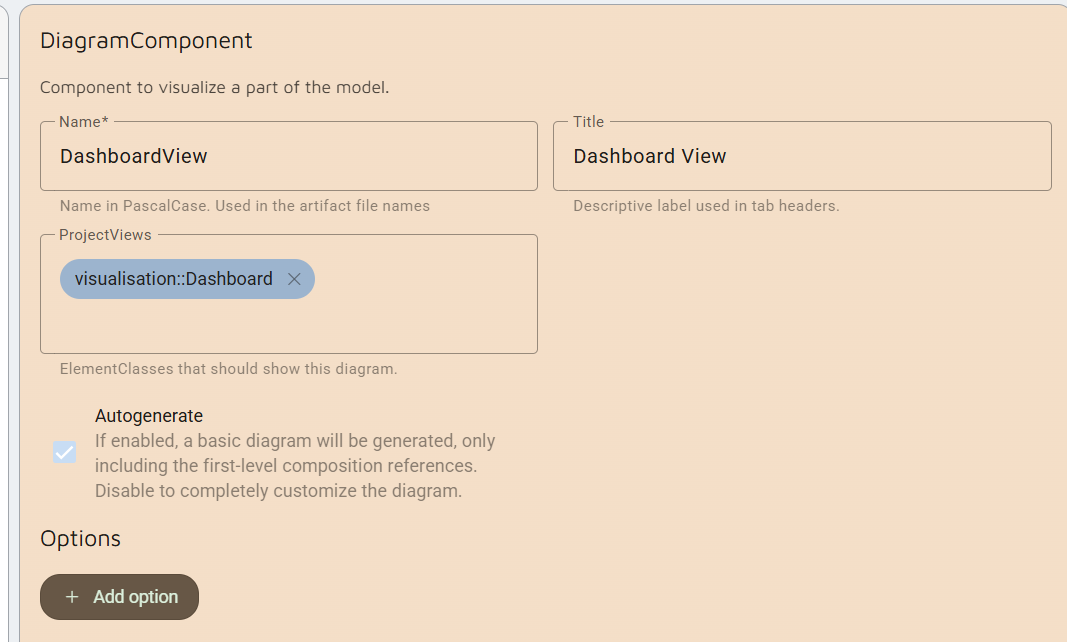
A DiagramComponent:
- targets ElementClasses for which this diagram should be shown (with said ElementClass as root of the diagram).
- can either be autogenerated or completely custom made.
- is defined in the plugin-model.
Option 1: Autogenerate a diagram
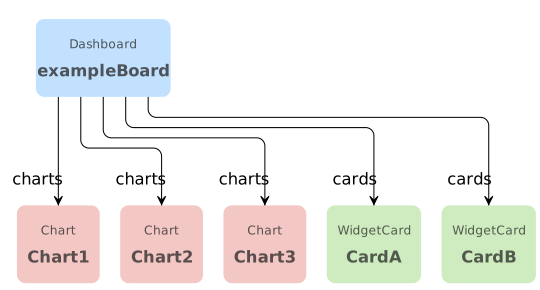
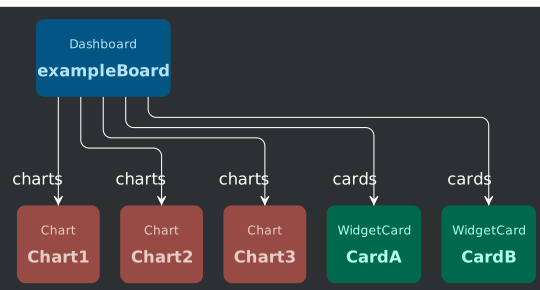
An Example of the autogenerate:
- Let's assume a metamodel to model dashboards. A
Dashboardhas compositionReferences toChartand toWidgetCard.Charthas a compositionReference toFilter.Dashboardalso has an associationReference toDatabaseConnection. - When modeling a
DiagramComponentwith target elementClassDashboard:- The
Dashboardwith itschartsandwidgetCardswill be shown. - The
DatabaseConnectionand thefiltersof thechartswill not be shown.
- The
Option 2: Create a custom diagram
You might want to create a diagram component that is completely custom. In this case, the autogenerate would be set
to false.
Extensive documentation on what can be done with the diagram components can be found in the developer portal.
A short summary of how to customarily create a class diagram:
1. Create a DiagramComponent in the plugin model.
2. Find the expanded .component.html file of the diagram. Activate the glint diagram angular component:
<!-- anchor:custom-diagram:start -->
<glint-diagram-control-layout>
  <glint-class-diagram diagram [graph]="graph()">
  </glint-class-diagram>
</glint-diagram-control-layout>
<!-- anchor:custom-diagram:end -->
3. Find the expanded .component.ts file of the diagram. Here the graph() method needs to be implemented to pass
to the component.
// anchor:custom-members:start
graph = computed(() => {
  const graph = createGraph<ClassNode, ClassReference>()
  //
  // Build graph
  //
  return graph
})
// anchor:custom-members:end
4. In this .ts file, in the graph, you can now build nodes and edges. Important to know is that you can access
the model of the elementClass this diagram targets via this.model in this file.
- An example of a node:
graph = computed(() => {
  const graph = createGraph<ClassNode, ClassReference>()

  const sourceNodeId = `node::${this.model._id || 'current'}`
  const typeLabel = this.model.sourceType?.name || 'N/A'
  graph.node({
    data: {
      id: sourceNodeId,
      className: this.model.name || 'Current Node',
      stereotype: '...',
      source: this.model,
      members: [
        {
          id: `${sourceNodeId}::sourceType`,
          name: 'sourceType',
          type: typeLabel,
          source: this.model
        }
      ]
    },
    layout: {
      style: NodeStyle.PRIMARY
    }
  })
  ...
- An example of an edge:
...
 graph.edge({
   data: {
     id: `edge::${sourceNodeId}::${childNodeId}`,
     label: 'connects',
     source: ...
   },
   type: EdgeType.CONNECTION,
   from: sourceNodeId,
   to: childNodeId
  })
 }