Prime Radiant: What and how we measure our software

Writing good code at NSX is easy: You model a workflow, choose a fitting task name, and start writing a simple
business
calculation (e.g. summing your invoice lines to an invoice total).
Your code is clean and well-structured, and you build on the foundation of a qualitative stack.
Thanks to the expand and build in the micro-radiant, our expansion framework, automagically, delivers a whole set of
code.
It supplies you with modern user interfaces, it manages data persistency, exposes an API and much more.
But once in a while, a more daunting task might require you to extend the stack with unsupported functionality... Maybe your client wants to export his data in a proprietary report structure, or you need to integrate with an obscure authentication framework, or maybe your client wants all action buttons validated with a PIN code.
To ensure these custom additions (and for that matter all code) remain maintainable, we track each project with automated measures. In this post, we explain how we measure each project and how these measures help you to keep your project in good shape.
Gathering data throughout the build pipeline
At NSX, we provide each project with a default build pipeline. The pipeline integrates with a whole set of tools that capture dependency health, calculate test coverage, define code metrics and analyze your code structure.
The different stages in the pipeline might call an external system or produce a report artifact. All this information is afterwards aggregated and linked to your application in our central intelligence platform: Prime Radiant.
A deeper look into our pipeline
The lifecycle of a pipeline consists of several stages that produce measures:
- Build: Executes the
mvn packagecommand. This uses the CycloneDX plugin to generate abom.json(Bill of Materials). - Report: Pushes the
bom.jsonto DependencyTrack for security analysis. It also triggers SonarQube for code quality and gets asonar-xml.reportwith high-level statistics back. - NS-Audit: Calls our custom NS Audit Tool that validates code on NS principle violations and generates an
audit.jsonresult. - Analyze: This is where the Project Analyzer comes in. It scrapes the source code, counts files, and interprets
the models. It reads the
bom.json,audit.json, andsonar-report.xmland pushes everything to Prime Radiant.
Project Analyzer
The analyzer is a central Java application that we developed in-house. It is responsible for parsing all measure data available in the pipeline, calculating additional measures, and sending everything to Prime Radiant.
Some of the measures that it calculates include:
- Codesize: Measuring the total footprint of the codebase.
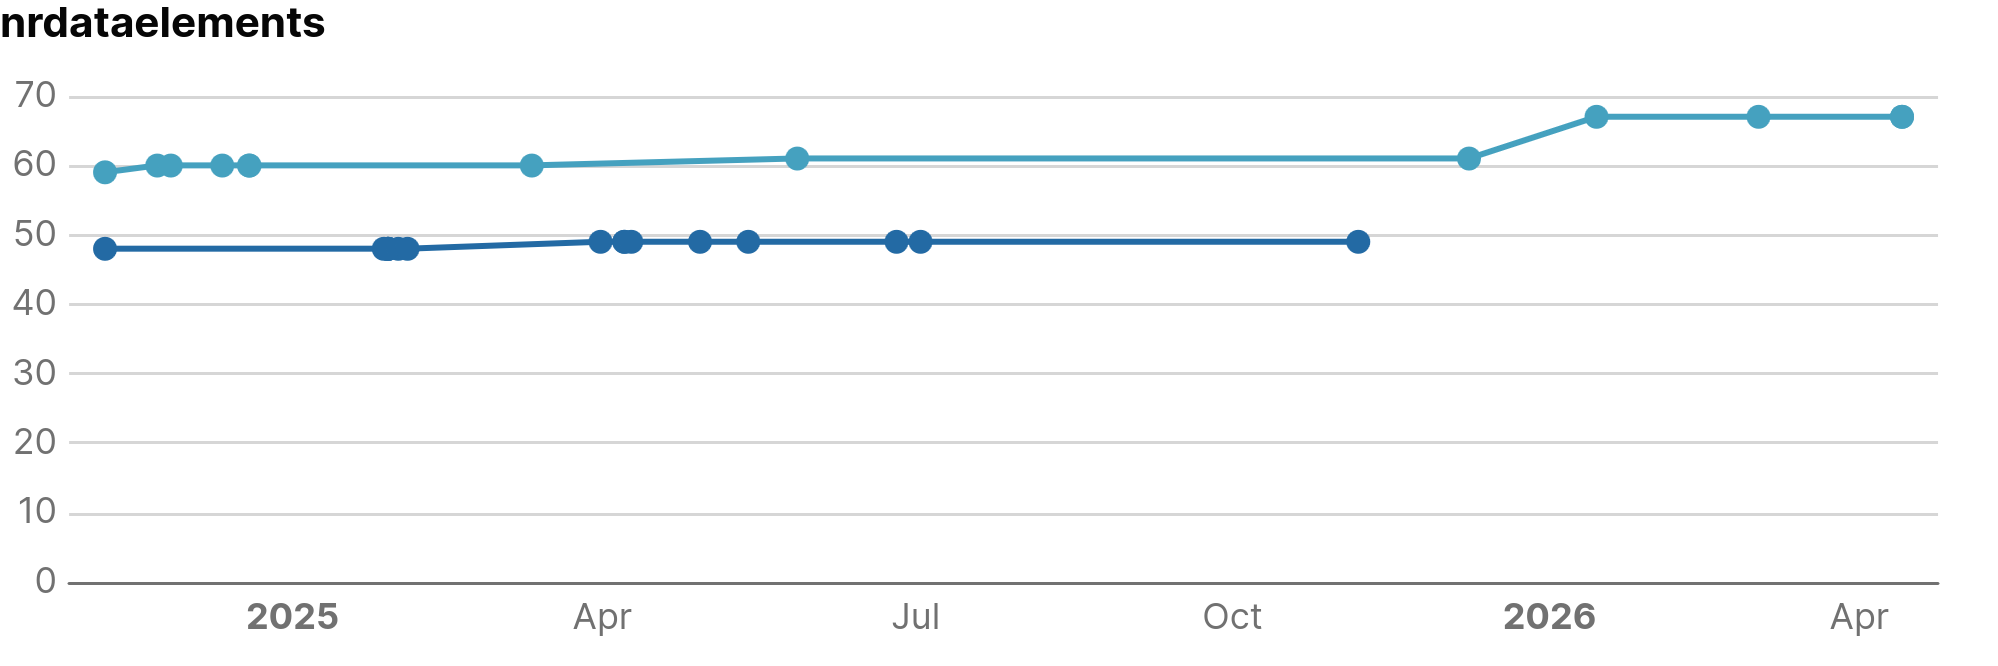
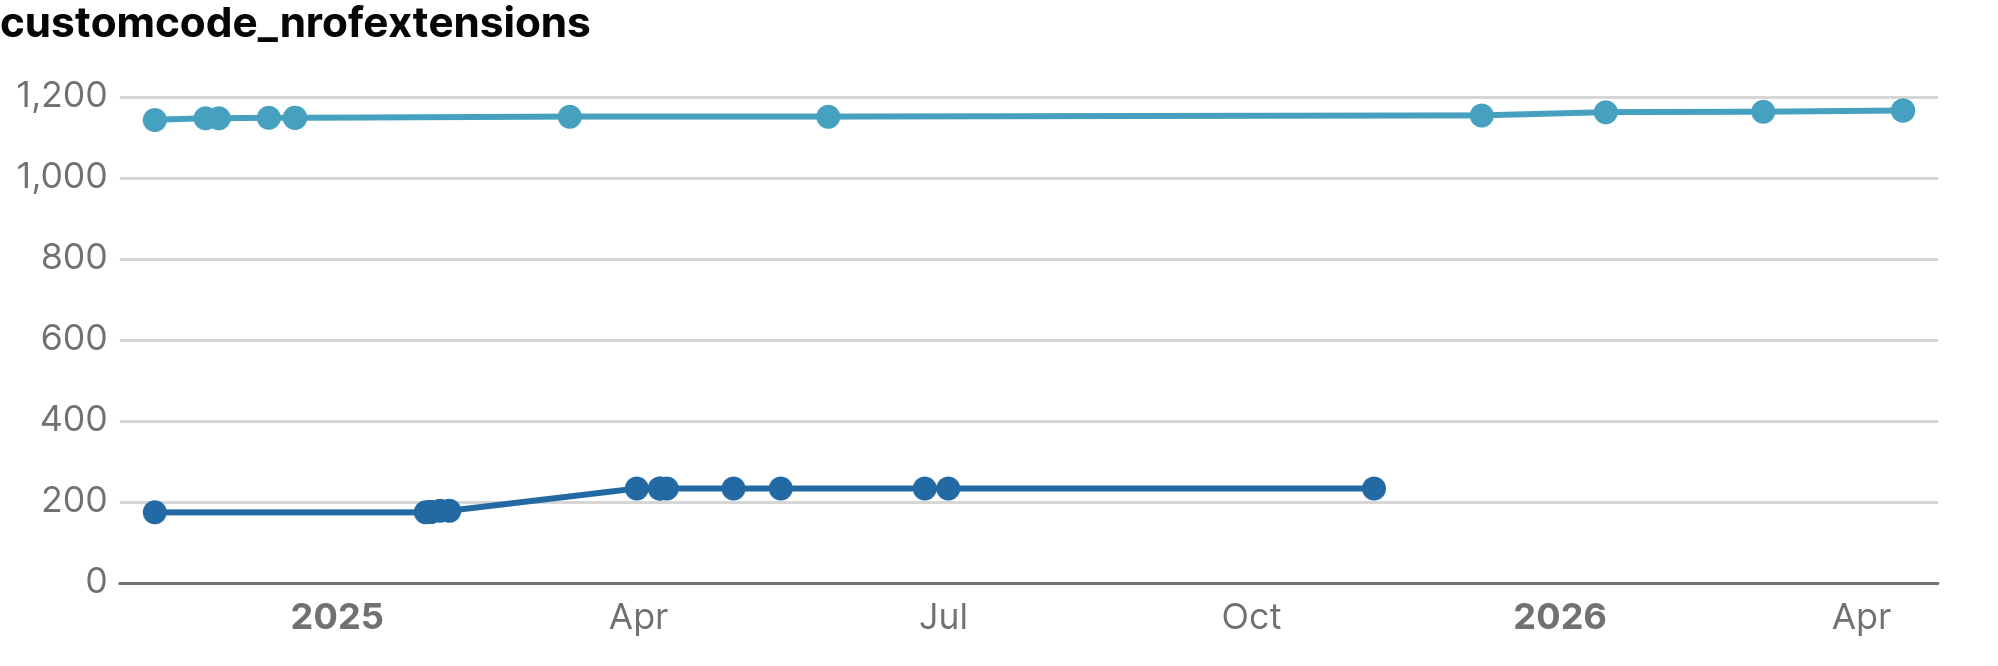
- Model size: Reading the application model and determining the amount of model elements of each type (Data Elements, Tasks, Flows, etc.).
- Detecting extensions and insertions: Identifying specific points in the source code where you added custom code or extended the framework.
- Overlays: Looking for overlays to see where the generated templates are overwritten.
While the project analyzer provides most of the measure data, some project-independent data is gathered by the Prime Radiant directly. One of such example is pulling vulnerability data from an open platform to enrich our internal dependency health measures.
What do we measure?
For applications, we split our measures into two main categories: Size Metrics and Quality Metrics.
Measures that are shared with other software artifact types are linked to the generic element AssemblyUnitBatch, application-specific measures are linked to ApplicationVersion.
Plugins, Expansion Resources and libraries have their own set of measures which are out of scope of this article.
Size Metrics
Size metrics describe the size of your codebase and model. These are useful for:
- Tracking growth over time: See how your application size is evolving (e.g. How many new data elements were introduced in the last year to monitor application's growth.)
- Defining "peer" applications: Find similar projects to use as a benchmark. (e.g., If an application with the same amount of data elements has three times the workflows, maybe you should model your flows more granularly).
- Normalizing quality metrics: Use size to put quality in context. (e.g. How much custom code do you have per data element, and does it remain stable as you grow?).
Quality Metrics
Quality metrics check how solid the code is. We group these measures into three areas: Custom code, quality and dependencies.
1. Custom Code & Overlays
These measures quantify how an application extends the generated stack. We monitor these to identify projects that are becoming overly customized, which increases the complexity of future upgrades and maintenance.
-
CustomCodeMeasure: We track
nrOfExtensions(files) andnrOfInsertions(files with code added within anchors). We also monitortotalSizeExtensionsandtotalSizeInsertionsin bytes to assess the volume of custom implementation logic. -
OverlayMeasure: This tracks overrides of standard files via
nrOfOverlaysandtotalSizeOverlays. A high overlay count often indicates that the core framework lacks a specific feature, leading to project-specific workarounds.
2. Code Quality (SonarQube)
Code quality metrics are primarily derived from SonarQube, focusing on three technical domains: Reliability ( functional correctness), Maintainability (ease of modification), and Security (resistance to exploits).
Issue counts
The aggregated issue counts help you validate code stability over time and can be used to benchmark your application against others in the Prime Radiant
- maintainabilityIssues: The count of technical patterns that increase complexity and make the codebase more difficult to modify.
- reliabilityIssues: The count of logic errors that increase the probability of runtime failures.
- securityIssues: The count of security flaws that represent potential points of exploitation.
- Severity Breakdown: Issues are categorized as
lowSeverityIssues,mediumSeverityIssues, orhighSeverityIssuesbased on internal rankings of SonarQube.
Ratings
A rating tries to quantify the quality of your application in a single number (based on all detected issues). Any rating deviating from the best grade (1) might be a good starting point to start improving your application.
- debt: The estimated effort (in minutes) required to remediate all open maintainability issues.
- maintainabilityRating: A grade (1-5) based on the Debt Ratio (the cost to fix the code vs. the cost to rewrite it).
- reliabilityRating: A grade (1-5) derived from the severity of the most critical open bug.
- securityRating: A grade (1-5) based on the severity of the most critical open vulnerability.
Code complexity
- duplication: The percentage of repeated code blocks.
- cyclomaticComplexity: A mathematical measure of the number of linearly independent paths through the code. It reflects how difficult the code is to unit test.
- cognitiveComplexity: A measure of how difficult the code is to understand for a human. It penalizes nested loops and complex logic structures.
3. Dependency measures
Managing dependencies is an important factor in application quality. Every external library added increases the maintenance surface of the application and introduces external risks.
At NSX, we use Renovate Bot to automate update tracking. However, updates still require careful (and manual ) management. Breaking changes may require refactors, and version updates may unintentionally impact internal implementations.
Dependencies also extend the application's attack surface. Vulnerabilities within third-party libraries become direct security risks for the project.
We monitor:
- nrVulnerabilities: The total vulnerability count, categorized from
nrCriticaltonrInfo. The urgency category is based on public CVE scores. - nrOutdatedVersions: The number of dependencies currently behind the latest (known) release.
What's next?
Analyzing our projects and storing this information in a structured way is just the first step. As a chief engineer, it is up to you to watch over your application's health.
The Prime Radiant offers you a view to check, from time to time, how your application is doing. In the daily run of a project, it is surprisingly easy to forget best practices, choose a quick shortcut, or leave a "dirty patch" that never gets fixed.
Tracking these measures allows you to reflect on this evolution and make time for a necessary refactor in a specific component or layer (i.e. if you went a little wild with UI customizations).
To help you with this, the Prime Radiant team is working on:
- Automated notifications: Get alerts via mail, Slack, or build failures when your project crosses defined measure thresholds.
- Dashboard views: Compare your application with other projects to detect trends or evolutions that might be less than ideal.
Below is a dashboard preview showing an application with an unusually high number of extensions compared to its data elements: